PURCHASING > Setup system> Dashboard configuration > Configure dashboards
Since different users will want to see different information on their dashboards, you can create multiple dashboard configurations, each with different Key Performance Indicators (KPIs). For example, you might create a dashboard for your CEO or Finance Team (with KPIs such as spend by department, budget status, invoices waiting for approval, etc.), and a separate dashboard for the Purchasing Department, with things like the number of late Purchase Orders, requisitions waiting for approval, and spending trends over time.
You can then assign one or more of the dashboard configurations to users in the [Dashboard] folder of the User Master File.
NOTE: You do not have to use more than one dashboard configuration. If everyone wants to see the same information when viewing the dashboard, simply create a single configuration and assign that configuration to all users.
Dashboard Configuration Screen
This utility uses the same style of screen as the system's Master Files, so you can use the navigation buttons and the [FIND] button at the bottom of the screen to move to a different dashboard configuration, you can [ADD] and [DELETE] configurations, and you can copy an existing configuration by clicking [ADD] and then enter an existing configuration code in the Code Field.
Information for dashboard configurations is organized into the following folders (tabs).
Folder |
Description |
•Information that shows when viewing the dashboard itself, or in other areas of the system that reference dashboard information and settings. |
|
•Used to customize the dashboard configuration by adding, modifying or deleting the Key Performance Indicators (KPIs) that users will see when viewing the dashboard. |
General Folder
The Folder contains information that shows when viewing the dashboard itself, and in other areas of the system that reference dashboard information and settings.
Dashboard Configuration Folder
The Folder is used to add, modify or delete Key Performance Indicators (KPIs) that users will see when viewing the dashboard.
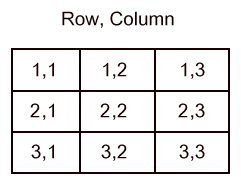
The folder displays a summary list of the existing KPIs that are included in the dashboard configuration. Note the Position Column, which shows the row (vertical position) and column (horizontal position) where each KPI will appear when viewing the dashboard. To preview the actual dashboard, use the [PREVIEW] button.
NOTE: When you [ADD] or [COPY] KPIs, they will be added to the bottom of the list but will be reorganized in the list based on the position (i.e. row and column) when you [SORT] or [SAVE] the dashboard configuration. [SORT] will reorganize the list based on the position specified for each KPI, while [SAVE] will reorganize the list AND remove any blank/missing rows and columns.
TIP: If your dashboard includes multiple KPIs that are similar to one another, instead of using [ADD] to start from scratch for each new KPI, you can save time by using [COPY], then just [MODIFY] the new KPI.
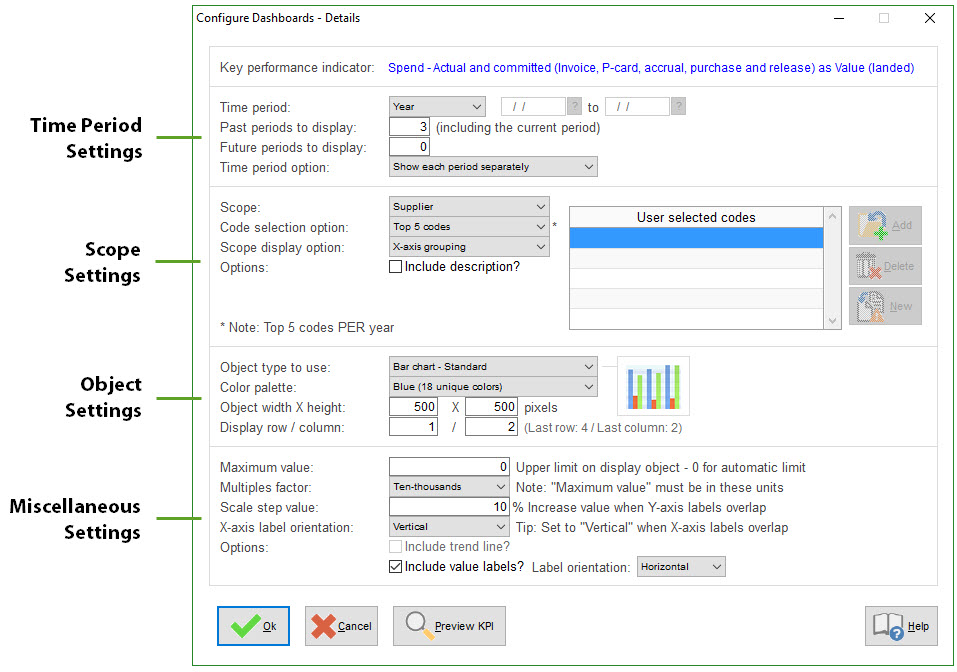
This screen is used to configure/customize how the KPI will appear on the dashboard.
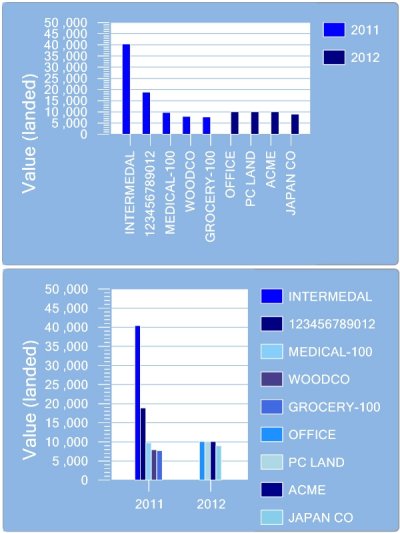
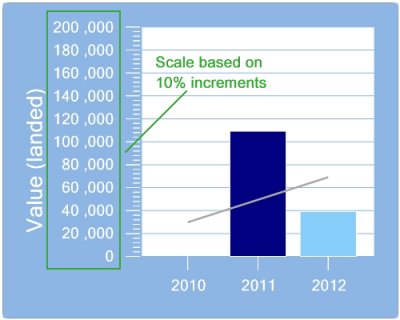
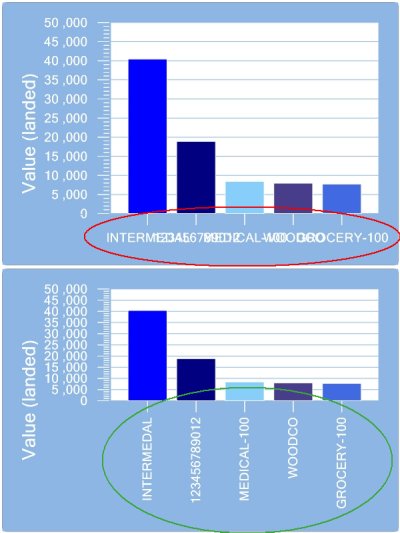
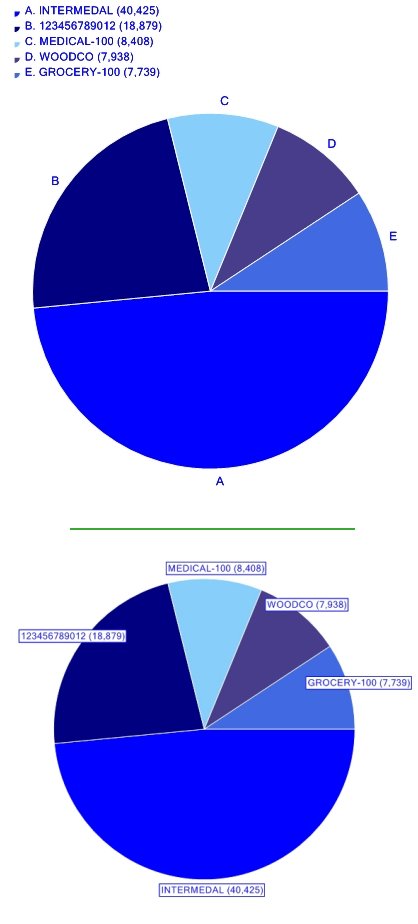
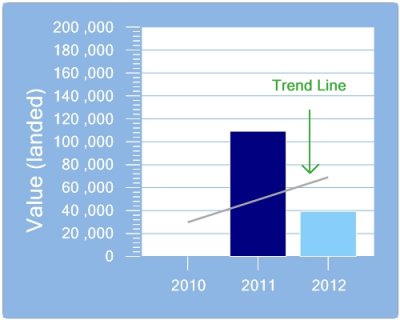
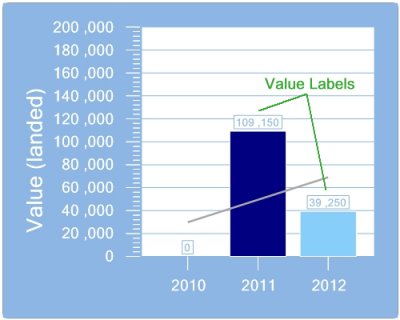
The screen is divided into the following four sections, 1) Time period settings, which determine how much history/data to include in the calculation of the KPI, 2) Scope settings, which determine which codes (e.g. suppliers, items, cost centers, etc.) to include in the KPI, 3) Object settings that determine the type, size and position of the object on the dashboard, and 4) Miscellaneous settings used to fine-tune how the KPI/object will appear.
