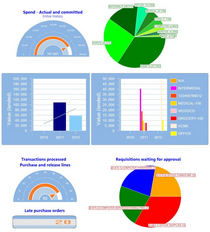
To complement the system's detailed reporting capabilities, SpendMap's Executive Dashboard provides a graphical presentation of Key Performance Indicators (KPIs), to enable instantaneous and informed decisions to be made at a glance.
The dashboard can be configured for each user (or group of users), to show only the information of interest to each person or role (e.g. the CEO may want to see different information than Department Managers, etc.).
A few examples of some of the 50 KPIs include...
•Spend in dollars, by vendor, by user, by cost center, etc.
•Number of late documents (e.g. late POs, late RFQs, etc.)
•Inventory stats (e.g. inventory dollar value, excess inventory, etc.)
•Supplier performance
•Savings from early payment discounts
•Lost savings from late payments
•Many more
Multiple, Configurable Dashboards, by User
You can set up one or more dashboards in Configure Dashboards, each with one or more KPIs.
For example, you might create a dashboard for your CEO or Finance Team (with KPIs such as spend by department, budget status, invoices waiting for approval, etc.), and a separate dashboard for the Purchasing Department, with things like the number of late Purchase Orders, requisitions waiting for approval, and spending trends over time.
You can then assign one or more of the dashboards to each user in the [Dashboard] folder of the User Master File.
Viewing and Refreshing the Dashboard Data
Users can view their dashboards at any time using View My Dashboard.
Information (data) on the dashboards will be accurate as of the last refresh. The dashboard date would typically be refreshed as part of your nightly, off-hours maintenance routine.


